Ascochyta rabiei Dashboard
Disclaimer
The information presented in this website is derived from samples generously contributed by farmers, agronomists, and plant pathologists from the major Australian chickpea growing regions. As such, it is inherently biased towards paddocks and regions where Ascochyta blight is monitored (and reported) more frequently by our collaborators and should be interpreted accordingly. Sample locations have been reassigned to the nearest town for privacy reasons.
To participate in this research, obtain further information and management practices recommendations, please contact Ido Bar or Professor Rebecca Ford via email or socials accounts.
-
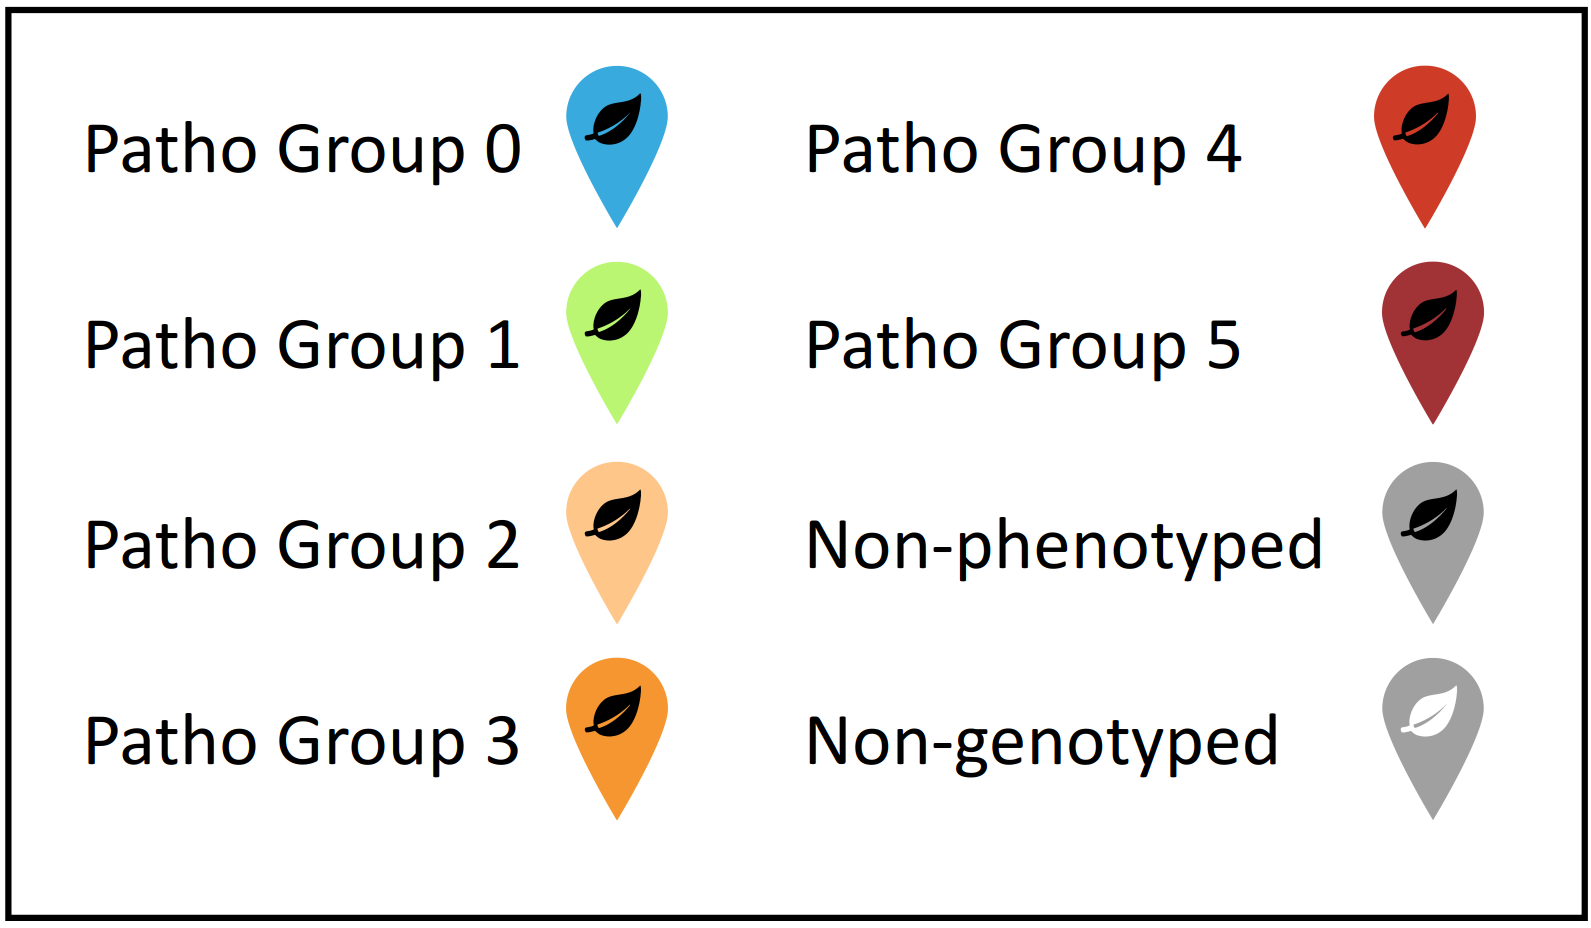
Map legend
Agroecological zone summary
Isolate Database
Ascochyta rabiei isolates collected and phenotyped between 2013-2024 as part of GRDC projects GRI2407-001RTX, GRI2007-001RTX and UM00052
Isolate pathogenicity classification
Each isolate is assessed for its ability to infect and cause disease symptoms on a differential set of chickpea hosts (with varying degrees of resistance/susceptibility to the disease). The disease assays are performed on seedlings (5-node stage, approx. 2 weeks old) in controlled-environment rooms, with conditions ideal for AB disease development, in a replicates, "blind" pot design. Three weeks after inoculation, each infected plant-isolate combination is assessed for its disease severity/symptoms on the leaves and stem of the plants.
The disease scores are then summarised for each isolate using a weighted mean, averaging the stem and leaf lesion scores across replicates, which are weighted based on the host's disease resistance rating (according to our bioassays, GRDC NVT ratings and expert advice from chickpea breeders and senior pathologist, see more details in the Tutorial tab )
Dashboard Tutorial
The dashboard consists of four pages which can be accessed using the left sidebar on the dashboard (seen highlighted in the red frame in the screenshot below). The sidebar also provides an additional “reset” button to reset the dashboard to its original state and contact-us icons (highlighted with a grey frame below). The navigation sidebar can be collapsed using the icon next to the AscoDashboard (marked with a blue arrow at the top left of the screenshot below). The top navigation bar also includes two filtering buttons that enable interactive filtration of the data points that produce the map and agroecological zone summary table by Pathogenicity Group or Collection Date (marked with black arrows at the top of the screenshot below).
A collapsible information tab which provides a brief description of the data collected in the project can be expanded by clicking on the icon in the right side of the top bar (marked with a white arrow at the top right of the screenshot below). The colour theme of the entire website can be selected by the users using the skin selector at the very bottom of the navigation bar.
Further information on each page is detailed below:
Main Page
The main page of the dashboard consists of an interactive map illustrating the locations of the collected A. rabiei isolates and their associated collection and pathogenicity data (if phenotyped). Users can easily zoom in and out of the map to obtain a detailed information of each isolate and their phenotypic data (seen in the highlighted yellow frame below). The top right corner of the map includes a icon (marked with an orange arrow at the screenshot below), which opens a collapsible pane with the map legend to demonstrate how isolate pathogenicity levels are presented in the map. Users can also use the icon to replace the basemap and add or remove map layers such as agroecological zones (soil and climate data may be implemented at a later stage). Both features can be seen in the highlighted green frame below.
Other features of the main page are the summary table of isolates collected, phenotyped and genotyped from each agroecological zone (which changed dynamically based on the isolate filtering criteria) and two graphs below the map showcasing the frequency of highly aggressive isolates and the classification of the pathogenicity groups. The top right corner of each graph includes a collapsible pane which allows users to download the graphs (seen in the highlighted orange frame and activated with the icon marked with yellow arrows below).
## Error in `knitr::include_graphics()`:
## ! Cannot find the file(s): "tutorial_screenshot_07_08_2023_labelled.png"
Isolate Data Page
The second page of the dashboard includes a full table of the collected and phenotyped isolates (from 2013-2024) that can be searched by a keyword (see yellow arrow and example in the screenshot below), sorted by values, or copied/printed/downloaded using the controls at the bottom of the table (see green arrow in the screenshot below).
Note that samples collected prior to 2020 do not appear in the map due to inconsistent or missing sampling location data.
Isolate pathogenicity classification
Each isolate is assessed for its ability to infect and cause disease symptoms on a differential set of chickpea hosts (with varying degrees of resistance/susceptibility to the disease). The disease assays are performed on seedlings (5-node stage, approx. 2 weeks old) in controlled-environment rooms, with conditions ideal for AB disease development, in a replicates, “blind” pot design. Three weeks after inoculation, each infected plant-isolate combination is assessed for its disease severity/symptoms on the leaves and stem of the plants, as detailed in Sambasivam et al., (2020) and Christie, Sambasivam and Bar (2021).
The disease scores are then summarised for each isolate using a weighted mean, averaging the stem and leaf lesion scores across replicates, which are weighted based on the host’s disease resistance rating (according to our bioassays, GRDC NVT ratings and expert advice from chickpea breeders and senior pathologist, see the table below). The “weighted disease score” allows the ranking of isolates by their pathogenicity, and adjusts the genotype weights to sum up to 1 to allow comparing ranking across bioassays, regardless of the exact combination of genotypes used in the differential host set in the bioassay (see equations below).
The isolates are further classified into pathogenecity groups based in their weighted disease score as specified below:
$$ w_i=\frac{w_i}{\sum w_{set}} $$
$$ WeightedScore= \frac{\sum{x_iw_i}}{\sum{w_i}} $$
| Genotype | Rating | Weight |
|---|---|---|
| Kyabra | VS | 0.100 |
| PBA Seamer | S | 0.200 |
| PBA HatTrick | S | 0.200 |
| CBA Captain | S | 0.200 |
| CBA 2051 | MS | 0.225 |
| Genesis 090 | MRMS | 0.250 |
| ICC3996 | MRMS | 0.250 |
| 1841C | MR | 0.275 |
| Weighted Score | Pathogenicity Group |
|---|---|
| 0-2.5 | PG0 |
| 2.5-3.5 | PG1 |
| 3.5-4.5 | PG2 |
| 4.5-5.5 | PG3 |
| 5.5-6.5 | PG4 |
| 6.5-9 | PG5 |
## Error in `knitr::include_graphics()`:
## ! Cannot find the file(s): "isolate_table_screenshot_25_02_2026_labelled.png"
References
Christie, M., Sambasivam, D.P. and Bar, I. (2021) ‘Chickpea Inoculation with Ascochyta rabiei for Ascochyta Blight Disease Assessment Under Controlled Conditions’, protocols.io [Preprint]. Available at: https://doi.org/10.17504/protocols.io.bw9iph4e.
Sambasivam, P. et al. (2020) ‘Evidence of recent increased pathogenicity within the Australian Ascochyta rabiei population’, bioRxiv, p. 2020.06.28.175653. Available at: https://doi.org/10.1101/2020.06.28.175653.
Tutorial Page
This tutorial.
Research Team
A brief biography and contact details of the research team developing and maintaining this website, please contact us for any enquiries, requests and feedback.